Flue Gas Analysis & Oxygen Measurement in Industrial Combustion Systems
A rigorous reference for instrumentation, control, and combustion engineers covering flue gas thermodynamics, excess air optimization, Nernst-equation electrochemistry, and the industrial deployment of zirconia and paramagnetic oxygen analyzers.
What is Flue Gas? Definition & Engineering Significance
Flue gas is the multi-component exhaust stream produced when fossil fuels, biomass, or waste materials undergo oxidation in fired equipment — including power boilers, process furnaces, gas turbines, and incinerators. It travels through a carefully designed exhaust pathway: flue ducts → economizers → air preheaters → electrostatic precipitators (ESP) or bag filters → induced draft (ID) fans → stack (chimney).
From a combustion engineering standpoint, flue gas is not simply waste exhaust. It is a real-time diagnostic stream that encodes combustion quality, excess air level, heat-transfer efficiency, and regulatory compliance status into its chemical composition, temperature, and flow rate.
Typical Flue Gas Composition
The precise composition is a function of fuel type, burner geometry, stoichiometric air ratio, combustion temperature, and downstream pollution control systems. The table below shows representative volumetric concentrations for natural gas and bituminous coal combustion under near-stoichiometric conditions.
| Component | Natural Gas (vol%) | Bituminous Coal (vol%) | Classification |
|---|---|---|---|
| Nitrogen (N₂) | 70–75% | 68–75% | Major |
| Carbon Dioxide (CO₂) | 8–10% | 12–16% | Major |
| Water Vapor (H₂O) | 14–18% | 6–9% | Major |
| Oxygen (O₂) | 2–5% | 3–6% | Major |
| Carbon Monoxide (CO) | <50 ppm | <200 ppm | Pollutant |
| Sulphur Dioxide (SO₂) | <1 ppm | 500–2500 ppm | Pollutant |
| Nitrogen Oxides (NOₓ) | 20–100 ppm | 200–600 ppm | Pollutant |
| Particulate Matter (PM) | Negligible | 1,000–5,000 mg/Nm³ | Pollutant |
| Ammonia (NH₃) | Trace | Trace–20 ppm | Pollutant |
| Hydrogen Fluoride (HF) | Trace | Trace–5 ppm | Pollutant |
Nitrogen dominates the composition because combustion air contains approximately 79% N₂ by volume (mole fraction ≈ 0.79). Unlike in oxy-fuel combustion, where pure oxygen replaces air, conventional air-blown combustion inherently dilutes products with nitrogen, which is chemically inert at typical flame temperatures below 1500°C (thermal NOₓ formation only becomes significant above ~1300°C).
Combustion Stoichiometry & Excess Air Engineering
The stoichiometric air-fuel ratio (AFR) defines the theoretical minimum mass of air required for complete oxidation of a unit mass of fuel. For practical engineering, this is the baseline from which excess air is calculated. The global combustion reaction for a generic hydrocarbon CxHy is:
Excess Air Calculation from O₂ Measurement
The single most important field-measurement for combustion efficiency is the flue gas oxygen concentration. Excess air percentage is derived directly from measured O₂ using the modified Ostwald formula:
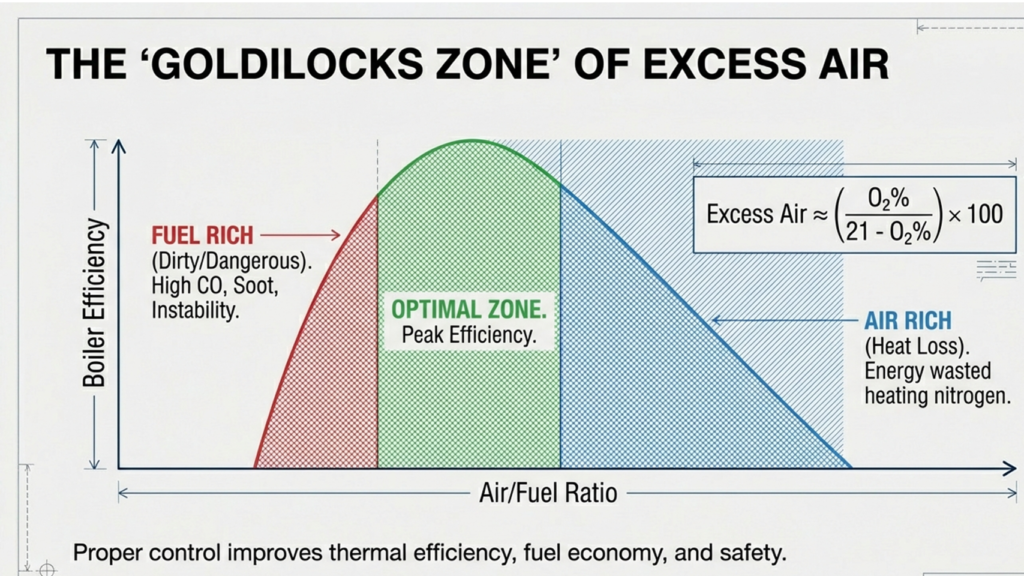
The Combustion Triangle: Efficiency vs. Emissions vs. Stability
⚠ Sub-Stoichiometric (Rich) Zone
- Excess Air< 0%
- Flue Gas O₂~0%
- CO FormationVery High
- Soot / Unburned CHigh
- Thermal EfficiencyPoor
- RiskExplosive
✓ Optimal Operating Zone
- Excess Air (Gas)5–15%
- Excess Air (Coal)15–25%
- Flue Gas O₂1–3%
- CO< 50 ppm
- Thermal EfficiencyMaximum
- Flame StabilityExcellent
↑ High Excess Air Zone
- Excess Air> 40%
- Flue Gas O₂6–8%+
- Stack Heat LossElevated
- NOₓ FormationElevated
- Fuel ConsumptionIncreased
- Flame TempReduced
Stack Heat Loss Formula
Stack dry heat loss (Siegert method):
- T_AStack temperature (°C)
- T_ambAmbient temperature (°C)
- A₁, B₁Fuel-specific constants
- CO₂%Vol% in flue gas
Flue Gas Oxygen Measurement Technologies
Accurate, continuous oxygen measurement in flue gas is the cornerstone of closed-loop combustion control. Two principal technologies dominate industrial applications: paramagnetic oxygen analyzers and zirconia (ZrO₂) electrochemical probes. Each is underpinned by distinct physics and is suited to different deployment scenarios.
1. Paramagnetic Oxygen Analyzers
Physical Principle: Faraday’s Magnetic Susceptibility
The operating principle exploits a unique physical property: molecular oxygen (O₂) is strongly paramagnetic (magnetic susceptibility χ ≈ +3,449 × 10⁻⁶ CGS at 20°C) due to two unpaired electrons in its outer orbitals. Nearly all other common flue gas constituents — N₂, CO₂, CO, H₂O — are weakly diamagnetic and are repelled from magnetic fields.
This difference in magnetic susceptibility of several orders of magnitude forms the physical basis for a highly selective oxygen measurement. The thermomagnetic (or “dumbbell”) design uses the variation in O₂ paramagnetic susceptibility with temperature, governed by the Curie law:
Instrument Architecture
The analyzer cell consists of a non-magnetic test chamber with a permanent magnetic field region. A pair of nitrogen-filled glass spheres (the “dumbbell”) is suspended on a platinum alloy torsion wire within the magnetic field. When O₂-containing gas enters, oxygen molecules are attracted into the strongest part of the field, displacing the spheres. The torsion wire deflects proportionally, and the angular displacement — detected optically or via a mirror-reflected beam — is the output signal.
In thermomagnetic instruments, a heated platinum resistance wire (operating at 250–320°C) warms the gas locally, reducing its susceptibility. This induces a convective circulation (thermomagnetic convection) that creates a pressure imbalance in a Wheatstone bridge circuit. The bridge imbalance is linearly proportional to O₂ partial pressure.
Application Envelope
Paramagnetic analyzers require a clean, dry, conditioned sample — an extractive sample conditioning system (ECSS) including heated sample line, particulate filter, moisture condenser, and pump is mandatory. Response time is typically 15–60 seconds from sample point. Despite higher maintenance burden, laboratory-grade accuracy (±0.01% O₂) makes them the reference standard for emissions monitoring systems (EMS/CEMS) and calibration duties.
2. Zirconium Oxide (ZrO₂) In-Situ Oxygen Analyzers
Electrochemical Principle: The Nernst Equation
Yttria-stabilized zirconium oxide (ZrO₂ doped with 8–10 mol% Y₂O₃) is a solid oxide electrolyte that conducts oxygen ions (O²⁻) at elevated temperature (600–850°C) via a vacancy diffusion mechanism in the fluorite crystal structure. When flue gas and a reference gas (atmospheric air, P(O₂) = 0.2095 atm) are separated by the zirconia membrane, an electromotive force (EMF) is generated:
At 850°C operating temperature and 3% O₂ in flue gas, the Nernst equation yields approximately E ≈ 52 mV. The logarithmic relationship means the probe has exceptional sensitivity at low O₂ concentrations — ideal for near-stoichiometric combustion control where the critical measurement range is 0.5–5% O₂.
Probe Construction & Materials
The sensing element is a closed-end ceramic tube (typically 300–600 mm insertion length) fabricated from yttria-stabilized zirconia. Inner and outer platinum electrodes (porous sintered Pt) provide electrical contact. The probe tip is inserted directly into the flue gas duct — operating temperatures at the tip can reach 600–1400°C depending on the application.
Combustion performance of the ZrO₂ cell depends critically on maintaining stable operating temperature. A ceramic-sheathed electric heater or, in high-temperature applications, the flue gas itself provides the necessary thermal energy. An integrated thermocouple monitors cell temperature and enables the transmitter to apply temperature compensation to the Nernst calculation.
Signal Conditioning & Digital Outputs
The raw millivolt Nernst output is processed by a microprocessor-based transmitter that linearizes the equation, applies temperature compensation, and outputs industry-standard signals: 4–20 mA analog, HART protocol, Modbus RTU/TCP, or PROFIBUS-DP for DCS/PLC integration. Modern smart transmitters also calculate excess air and CO₂ equivalents internally.
Technology Comparison: Paramagnetic vs. Zirconia
| Parameter | Paramagnetic Analyzer | Zirconia (ZrO₂) Probe | Engineering Impact |
|---|---|---|---|
| Measurement Principle | Thermomagnetic susceptibility | Electrochemical (Nernst) | Fundamentally different physics — both highly selective |
| Installation Mode | Extractive (remote) | In-situ (direct) | ZrO₂ eliminates sample conditioning system cost |
| Response Time | 15–90 seconds | 2–10 seconds | Critical for tight combustion control loops |
| Accuracy | ±0.01–0.02% O₂ | ±0.1–0.5% O₂ | Paramagnetic preferred for CEMS/regulatory reference |
| Operating Temp (Gas) | <60°C (conditioned) | Up to 1400°C (direct) | ZrO₂ handles harsh environments without conditioning |
| Sample Conditioning | Mandatory (filter, chiller, pump) | Not required | ~30–50% of extractive system cost is conditioning |
| Maintenance Interval | Weekly filter checks, quarterly calibration | 6–18 monthly cell inspection | ZrO₂ lower total cost of ownership |
| Key Interferences | NO₂, N₂O (paramagnetic gases) | Combustibles (CO, H₂, HC) — burn off O₂ | Both require gas-specific assessment |
| Preferred Application | CEMS, lab, clean gas | Combustion trim control, boiler optimization | Often complementary in the same plant |
| Typical Cost (installed) | $15,000–$40,000 | $3,000–$12,000 | Paramagnetic ~3x higher initial capital |
DCS Integration & Combustion Control Architecture
In modern power plants and process facilities, oxygen analyzers are not standalone instruments — they are critical primary elements in the plant’s distributed control system (DCS) combustion control hierarchy. The following control loops depend directly on flue gas O₂ measurement:
Air-Fuel Ratio Control Loop
The primary combustion trim loop compares measured flue gas O₂ (from the ZrO₂ probe) against an O₂ setpoint that is itself a function of boiler load (MW). A PID controller output drives the forced draft (FD) fan vane position or variable speed drive (VSD) to maintain optimal excess air across the load range. A typical cross-limiting control (parallel positioning control) scheme ensures that fuel cannot increase before air increases, and air cannot decrease before fuel decreases — preventing fuel-rich excursions.
O₂ Setpoint Curve (Load-Based Optimization)
| Boiler Load | Optimal O₂ Setpoint (Gas Fuel) | Optimal O₂ Setpoint (Coal) | Excess Air Equivalent |
|---|---|---|---|
| 100% (Full Load) | 1.5–2.5% | 2.5–3.5% | 7–17% |
| 75% | 2.0–3.0% | 3.0–4.5% | 10–27% |
| 50% | 2.5–4.0% | 4.0–6.0% | 13–40% |
| 25% (Minimum) | 3.0–5.0% | 5.0–8.0% | 17–61% |
Higher excess air is required at low loads because flame stability becomes critical and air distribution becomes less uniform at reduced burner velocities.
Burner Management System (BMS) Integration
The BMS receives O₂ signals as a permissive element: if O₂ drops below a configurable low-alarm (typically 0.5–1.0%), a combustion fault alarm triggers, and if unresolved, initiates burner master fuel trip (MFT) to prevent furnace explosion risk. IEC 61511 (Functional Safety — SIS) classifies this as a Safety Instrumented Function (SIF) with required SIL level determined by the process hazard analysis (PHA/HAZOP).
Emission Compliance & CEMS Requirements
Continuous Emission Monitoring Systems (CEMS) are legally mandated by environmental regulations in most jurisdictions. The O₂ analyzer is a mandatory component of any CEMS installation — it enables flow normalization and provides the reference basis for pollutant concentration calculations under actual vs. reference O₂ conditions.
Reference Condition Correction Formula
Pollutant concentrations measured in a CEMS are corrected to a standard reference O₂ content (typically 6% for coal, 15% for gas turbines) as follows:
This formula ensures operators cannot artificially dilute flue gas with excess air to reduce reported pollutant concentrations — regulators define the reference O₂ denominator to normalize across operating conditions. In the EU, EN 14181 defines the QAL1/QAL2/QAL3 quality assurance levels for CEMS; in the United States, 40 CFR Part 75 (EPA) governs continuous emission monitoring.
Advanced Considerations for Flue Gas Analysis
Combustibles Interference on ZrO₂ Probes
A critical limitation of in-situ ZrO₂ probes is their susceptibility to combustibles interference. Carbon monoxide (CO), hydrogen (H₂), methane (CH₄), and other unburned hydrocarbons in the flue gas can oxidize at the hot platinum electrode surface, consuming local O₂ and causing the probe to report falsely low oxygen readings. This effect is particularly pronounced during combustion upsets, start-up, or when operating close to stoichiometric conditions.
Modern dual-cell probes address this by incorporating a separate combustibles sensor (typically a catalytic or electrochemical CO sensor) alongside the ZrO₂ cell. Combined O₂/CO measurement provides a complete picture and enables the DCS to detect whether a low O₂ reading is due to reduced excess air (controllable) or due to CO breakthrough (abnormal combustion fault).
Oxy-Fuel Combustion & Carbon Capture Applications
In oxy-fuel combustion systems (a key carbon capture and storage technology), the oxidizer is a mixture of recycled flue gas (~70% CO₂) and pure O₂ (~30%), replacing air. The O₂ measurement requirement is fundamentally different: O₂ concentrations in the recirculated stream may be 20–30% — outside the normal operating range of combustion-trim probes. Dedicated high-range O₂ analyzers (paramagnetic with extended range, or specialized electrochemical cells) are required.
Flue Gas Dew Point & Acid Condensation Risk
When sulphur-bearing fuels are burned, SO₂ is partially oxidized to SO₃, which combines with moisture to form sulphuric acid vapor. The acid dew point temperature (typically 110–160°C depending on SO₃ and H₂O concentrations) determines the minimum allowable flue gas temperature at the air preheater outlet. Operating below the acid dew point causes rapid corrosion of downstream equipment. Accurate flue gas composition data — including SO₃ and H₂O concentrations — is essential for dew point calculation.
- Flue gas O₂ is the primary variable for combustion control — a 1% improvement in excess air management typically yields 0.5–1% boiler efficiency gain.
- ZrO₂ in-situ probes are preferred for real-time combustion trim due to fast response and low maintenance; paramagnetic extractive analyzers are the CEMS reference standard for regulatory compliance.
- The Nernst equation governs ZrO₂ cell output — cell temperature stability is essential; a ±10°C error at 850°C induces approximately ±0.3% O₂ measurement error.
- O₂ analyzers in BMS/SIS applications must be assessed under IEC 61511 functional safety requirements; SIL classification must be confirmed via PHA/LOPA.
- CEMS O₂ correction factors ensure pollutant concentrations are reported at normalized reference conditions, preventing measurement gaming through excess air dilution.
- Combustibles interference (CO, H₂) can cause ZrO₂ probes to under-read O₂; dual-cell O₂/CO probes provide improved diagnostic capability.
References & Further Reading
- Baukal, C.E. (Ed.), The John Zink Combustion Handbook. CRC Press, 2001. — Comprehensive combustion engineering reference for stoichiometry, excess air, and pollutant formation.
- Turns, S.R., An Introduction to Combustion: Concepts and Applications, 3rd Ed. McGraw-Hill, 2011. — Foundational thermodynamics and chemical kinetics of combustion systems.
- Warnatz, J., Maas, U., Dibble, R.W., Combustion: Physical and Chemical Fundamentals, Modeling and Simulation, 4th Ed. Springer, 2006. — Advanced treatment of NOₓ/SOₓ formation mechanisms.
- International Society of Automation (ISA), ISA-77.44.01 — Fossil Fuel Power Plant Distributed Control and Monitoring Instrumentation. ISA, 2007.
- IEC 61511-1:2016, Functional Safety: Safety Instrumented Systems for the Process Industry Sector. International Electrotechnical Commission.
- NFPA 85:2019, Boiler and Combustion Systems Hazards Code. National Fire Protection Association.
- U.S. EPA, 40 CFR Part 75 — Continuous Emission Monitoring. U.S. Environmental Protection Agency, Washington DC.
- European Standard EN 14181:2014, Stationary Source Emissions — Quality Assurance of Automated Measuring Systems. CEN, Brussels.
- Göbel, A. et al., “Advances in Zirconia-Based Oxygen Sensors for Harsh Industrial Environments,” Sensors and Actuators B: Chemical, vol. 289, pp. 12–22, 2019.
- Siegert, H., “Berechnung der Verluste, die bei der Verbrennung fester, flüssiger und gasförmiger Brennstoffe entstehen,” VDI-Zeitschrift, vol. 54, 1898. — Original derivation of the Siegert stack-loss formula still in industrial use.
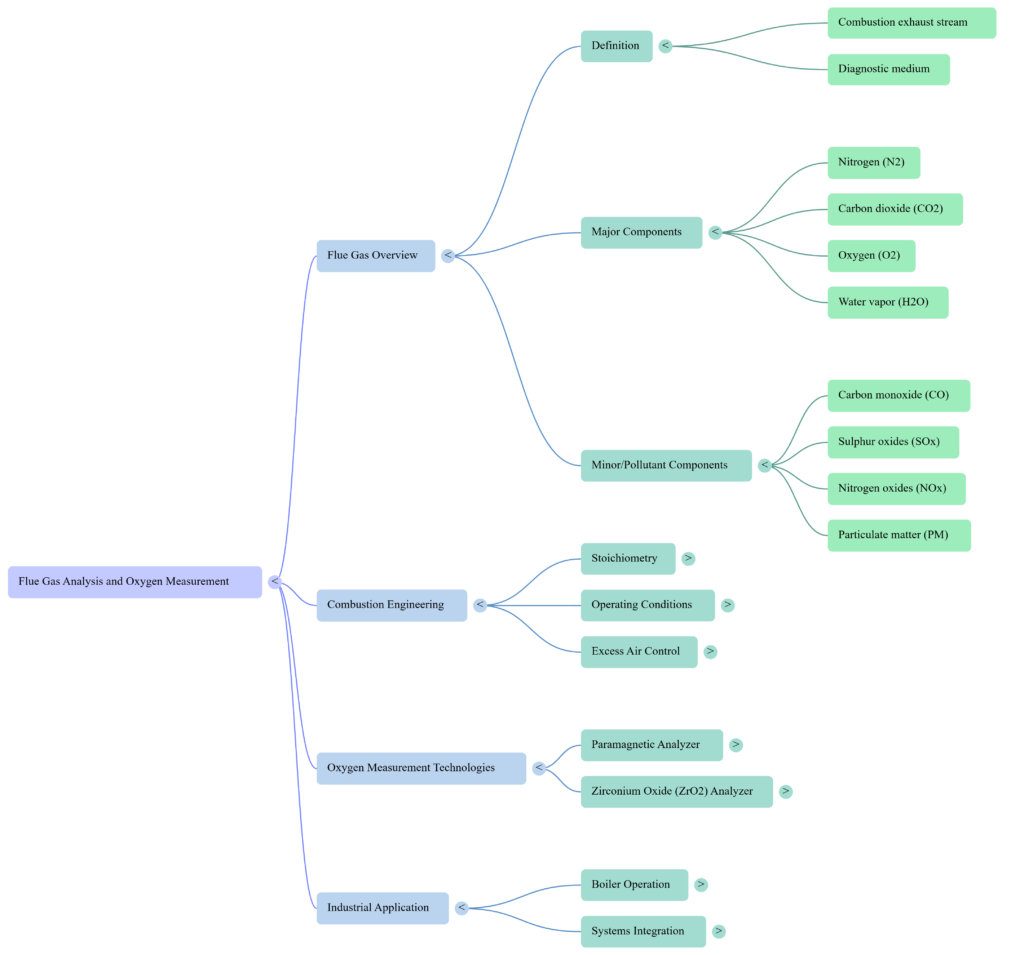
Mind Map